监控概述
监控对象:
1.监控对象的理解:CPU 是怎么工作的。原理 2.监控对象的指标:CPU使用率 CPU负载 CPU个数 上下文切换 3.确定性能基准线:怎么样才算故障?CPU负载多少才算高
监控范围:
1.硬件监控 服务器的硬件故障 2.操作系统监控 CPU 内存 IO 进程 3.应用服务监控 4.业务监控
硬件监控
服务器:
远程控制卡:DELL服务器:iDRAC
HP服务器:ILO IBM服务器:IMM方式:Linux就可以使用IPMI BMC控制器
工具:ipmitool
1.硬件要支持 2.操作系统 Linux IPMI 3.管理工具 ipmitool安装:yum install -y OpenIPMI ipmitool
启动:systemctl start ipmi
帮助:ipmitool help
使用IPMI有两种方式 1 本地调用 2 远程调用 (IP地址 用户名和密码)
ipmi配置网络,有两种方式:
1. ipmi over lan(通过网卡)2. 独立(通过插入网线控制)硬件监控方式: 1.使用IPMI 2.机房巡检
snmp安装: yum install -y net-snmp net-snmp-utils
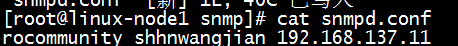
snmp配置:
cd /etc/snmp/mv snmpd.conf snmpd.conf.bakvim snmpd.conf
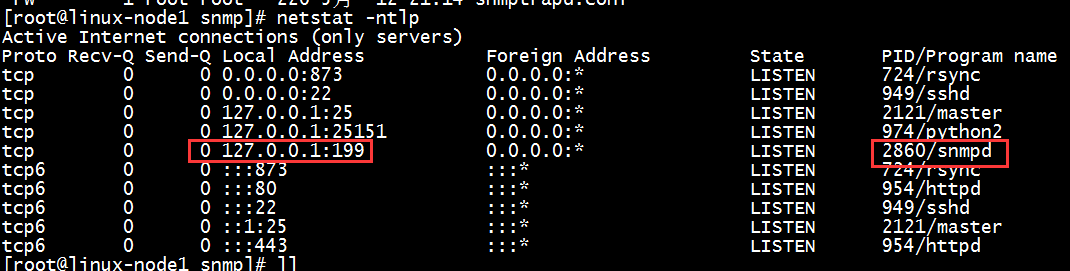
snmp启动: systemctl start snmpd
snmp默认udp启动端口:netstat -nulp

snmp默认tcp启动端口:netstat -ntlp


snmp参考文档:
snmpget -v2c -c shhnwangjian 192.168.137.11 1.3.6.1.2.1.1.3.0

1.3.6.1.2.1.1.3.0为OID
snmpget -v2c -c shhnwangjian 192.168.137.11 1.3.6.1.4.1.2021.10.1.3.1
这条命令表示获取一分钟系统平均负载

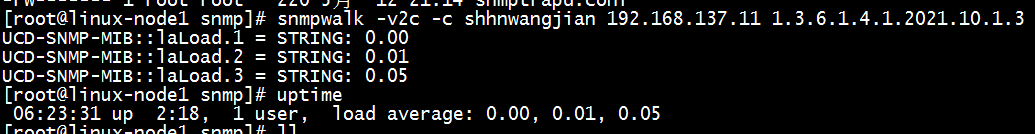
snmpwalk -v2c -c shhnwangjian 192.168.137.11 1.3.6.1.4.1.2021.10.1.3
这条命令表示获取一分钟、5分钟、15分钟的系统平均负载,等同于uptime
SNMP常用OID
1 minute Load: .1.3.6.1.4.1.2021.10.1.3.15 minute Load: .1.3.6.1.4.1.2021.10.1.3.215 minute Load: .1.3.6.1.4.1.2021.10.1.3.3CPUpercentage of user CPU time: .1.3.6.1.4.1.2021.11.9.0raw user cpu time: .1.3.6.1.4.1.2021.11.50.0percentages of system CPU time: .1.3.6.1.4.1.2021.11.10.0raw system cpu time: .1.3.6.1.4.1.2021.11.52.0percentages of idle CPU time: .1.3.6.1.4.1.2021.11.11.0raw idle cpu time: .1.3.6.1.4.1.2021.11.53.0raw nice cpu time: .1.3.6.1.4.1.2021.11.51.0Memory StatisticsTotal Swap Size: .1.3.6.1.4.1.2021.4.3.0Available Swap Space: .1.3.6.1.4.1.2021.4.4.0Total RAM in machine: .1.3.6.1.4.1.2021.4.5.0Total RAM used: .1.3.6.1.4.1.2021.4.6.0Total RAM Free: .1.3.6.1.4.1.2021.4.11.0Total RAM Shared: .1.3.6.1.4.1.2021.4.13.0Total RAM Buffered: .1.3.6.1.4.1.2021.4.14.0Total Cached Memory: .1.3.6.1.4.1.2021.4.15.0Disk StatisticsThe snmpd.conf needs to be edited. Add the following (assuming a machine with a single ‘/’ partition):disk / 100000 (or)includeAllDisks 10% for all partitions and disksThe OIDs are as followsPath where the disk is mounted: .1.3.6.1.4.1.2021.9.1.2.1Path of the device for the partition: .1.3.6.1.4.1.2021.9.1.3.1Total size of the disk/partion (kBytes): .1.3.6.1.4.1.2021.9.1.6.1Available space on the disk: .1.3.6.1.4.1.2021.9.1.7.1Used space on the disk: .1.3.6.1.4.1.2021.9.1.8.1Percentage of space used on disk: .1.3.6.1.4.1.2021.9.1.9.1Percentage of inodes used on disk: .1.3.6.1.4.1.2021.9.1.10.1System Uptime: .1.3.6.1.2.1.1.3.0ExamplesThese Commands you need to run on the SNMP serverGet available disk space for / on the target host#snmpget -v 1 -c “community” target_name_or_ip .1.3.6.1.4.1.2021.9.1.7.1this will return available disk space for the first entry in the‘disk’ section of snmpd.conf; replace 1 with n for the nth entryGet the 1-minute system load on the target host#snmpget -v 1 -c “community” target_name_or_ip .1.3.6.1.4.1.2021.10.1.3.1Get the 5-minute system load on the target host#snmpget -v 1 -c “community” target_name_or_ip .1.3.6.1.4.1.2021.10.1.3.2Get the 15-minute system load on the target host#snmpget -v 1 -c “community” target_name_or_ip .1.3.6.1.4.1.2021.10.1.3.3Get amount of available swap space on the target host#snmpget -v 1 -c “community” target_name_or_ip .1.3.6.1.4.1.2021.4.4.0Variable Descriptor Object Identifier System Group sysDescr 1.3.6.1.2.1.1.1 sysObjectID 1.3.6.1.2.1.1.2 sysUpTime 1.3.6.1.2.1.1.3 sysContact 1.3.6.1.2.1.1.4 sysName 1.3.6.1.2.1.1.5 sysLocation 1.3.6.1.2.1.1.6 sysServices 1.3.6.1.2.1.1.7 Interfaces Group ifNumber 1.3.6.1.2.1.2.1 ifTable 1.3.6.1.2.1.2.2 ifEntry 1.3.6.1.2.1.2.2.1 ifIndex 1.3.6.1.2.1.2.2.1.1 ifDescr 1.3.6.1.2.1.2.2.1.2 ifType 1.3.6.1.2.1.2.2.1.3 ifMtu 1.3.6.1.2.1.2.2.1.4 ifSpeed 1.3.6.1.2.1.2.2.1.5 ifPhysAddress 1.3.6.1.2.1.2.2.1.6 ifAdminStatus 1.3.6.1.2.1.2.2.1.7 ifOperStatus 1.3.6.1.2.1.2.2.1.8 ifLastChange 1.3.6.1.2.1.2.2.1.9 ifInOctets 1.3.6.1.2.1.2.2.1.10 ifInUcastPkts 1.3.6.1.2.1.2.2.1.11 ifInNUcastPkts 1.3.6.1.2.1.2.2.1.12 ifInDiscards 1.3.6.1.2.1.2.2.1.13 ifInErrors 1.3.6.1.2.1.2.2.1.14 ifInUnknownProtos 1.3.6.1.2.1.2.2.1.15 ifOutOctets 1.3.6.1.2.1.2.2.1.16 ifOutUcastPkts 1.3.6.1.2.1.2.2.1.17 ifOutNUcastPkts 1.3.6.1.2.1.2.2.1.18 ifOutDiscards 1.3.6.1.2.1.2.2.1.19 ifOutErrors 1.3.6.1.2.1.2.2.1.20 ifOutQLen 1.3.6.1.2.1.2.2.1.21 ifSpecific 1.3.6.1.2.1.2.2.1.22 IP Group ipForwarding 1.3.6.1.2.1.4.1 ipDefaultTTL 1.3.6.1.2.1.4.2 ipInReceives 1.3.6.1.2.1.4.3 ipInHdrErrors 1.3.6.1.2.1.4.4 ipInAddrErrors 1.3.6.1.2.1.4.5 ipForwDatagrams 1.3.6.1.2.1.4.6 ipInUnknownProtos 1.3.6.1.2.1.4.7 ipInDiscards 1.3.6.1.2.1.4.8 ipInDelivers 1.3.6.1.2.1.4.9 ipOutRequests 1.3.6.1.2.1.4.10 ipOutDiscards 1.3.6.1.2.1.4.11 ipOutNoRoutes 1.3.6.1.2.1.4.12 ipReasmTimeout 1.3.6.1.2.1.4.13 ipReasmReqds 1.3.6.1.2.1.4.14 ipReasmOKs 1.3.6.1.2.1.4.15 ipReasmFails 1.3.6.1.2.1.4.16 ipFragsOKs 1.3.6.1.2.1.4.17 ipFragsFails 1.3.6.1.2.1.4.18 ipFragCreates 1.3.6.1.2.1.4.19 ipAddrTable 1.3.6.1.2.1.4.20 ipAddrEntry 1.3.6.1.2.1.4.20.1 ipAdEntAddr 1.3.6.1.2.1.4.20.1.1 ipAdEntIfIndex 1.3.6.1.2.1.4.20.1.2 ipAdEntNetMask 1.3.6.1.2.1.4.20.1.3 ipAdEntBcastAddr 1.3.6.1.2.1.4.20.1.4 ipAdEntReasmMaxSize 1.3.6.1.2.1.4.20.1.5 ICMP Group icmpInMsgs 1.3.6.1.2.1.5.1 icmpInErrors 1.3.6.1.2.1.5.2 icmpInDestUnreachs 1.3.6.1.2.1.5.3 icmpInTimeExcds 1.3.6.1.2.1.5.4 icmpInParmProbs 1.3.6.1.2.1.5.5 icmpInSrcQuenchs 1.3.6.1.2.1.5.6 icmpInRedirects 1.3.6.1.2.1.5.7 icmpInEchos 1.3.6.1.2.1.5.8 icmpInEchoReps 1.3.6.1.2.1.5.9 icmpInTimestamps 1.3.6.1.2.1.5.10 icmpInTimestampReps 1.3.6.1.2.1.5.11 icmpInAddrMasks 1.3.6.1.2.1.5.12 icmpInAddrMaskReps 1.3.6.1.2.1.5.13 icmpOutMsgs 1.3.6.1.2.1.5.14 icmpOutErrors 1.3.6.1.2.1.5.15 icmpOutDestUnreachs 1.3.6.1.2.1.5.16 icmpOutTimeExcds 1.3.6.1.2.1.5.17 icmpOutParmProbs 1.3.6.1.2.1.5.18 icmpOutSrcQuenchs 1.3.6.1.2.1.5.19 icmpOutRedirects 1.3.6.1.2.1.5.20 icmpOutEchos 1.3.6.1.2.1.5.21 icmpOutEchoReps 1.3.6.1.2.1.5.22 icmpOutTimestamps 1.3.6.1.2.1.5.23 icmpOutTimestampReps 1.3.6.1.2.1.5.24 icmpOutAddrMasks 1.3.6.1.2.1.5.25 icmpOutAddrMaskReps 1.3.6.1.2.1.5.26 TCP Group tcpRtoAlgorithm 1.3.6.1.2.1.6.1 tcpRtoMin 1.3.6.1.2.1.6.2 tcpRtoMax 1.3.6.1.2.1.6.3 tcpMaxConn 1.3.6.1.2.1.6.4 tcpActiveOpens 1.3.6.1.2.1.6.5 tcpPassiveOpens 1.3.6.1.2.1.6.6 tcpAttemptFails 1.3.6.1.2.1.6.7 tcpEstabResets 1.3.6.1.2.1.6.8 tcpCurrEstab 1.3.6.1.2.1.6.9 tcpInSegs 1.3.6.1.2.1.6.10 tcpOutSegs 1.3.6.1.2.1.6.11 tcpRetransSegs 1.3.6.1.2.1.6.12 tcpConnTable 1.3.6.1.2.1.6.13 tcpConnEntry 1.3.6.1.2.1.6.13.1 tcpConnState 1.3.6.1.2.1.6.13.1.1 tcpConnLocalAddress 1.3.6.1.2.1.6.13.1.2 tcpConnLocalPort 1.3.6.1.2.1.6.13.1.3 tcpConnRemAddress 1.3.6.1.2.1.6.13.1.4 tcpConnRemPort 1.3.6.1.2.1.6.13.1.5 tcpInErrs 1.3.6.1.2.1.6.14 tcpOutRsts 1.3.6.1.2.1.6.15 UDP Group udpInDatagrams 1.3.6.1.2.1.7.1 udpNoPorts 1.3.6.1.2.1.7.2 udpInErrors 1.3.6.1.2.1.7.3 udpOutDatagrams 1.3.6.1.2.1.7.4 udpTable 1.3.6.1.2.1.7.5 udpEntry 1.3.6.1.2.1.7.5.1 udpLocalAddress 1.3.6.1.2.1.7.5.1.1 udpLocalPort 1.3.6.1.2.1.7.5.1.2 SNMP Group snmpInPkts 1.3.6.1.2.1.11.1 snmpOutPkts 1.3.6.1.2.1.11.2 snmpInBadVersions 1.3.6.1.2.1.11.3 snmpInBadCommunityNames 1.3.6.1.2.1.11.4 snmpInBadCommunityUses 1.3.6.1.2.1.11.5 snmpInASNParseErrs 1.3.6.1.2.1.11.6 NOT USED 1.3.6.1.2.1.11.7 snmpInTooBigs 1.3.6.1.2.1.11.8 snmpInNoSuchNames 1.3.6.1.2.1.11.9 snmpInBadValues 1.3.6.1.2.1.11.10 snmpInReadOnlys 1.3.6.1.2.1.11.11 snmpInGenErrs 1.3.6.1.2.1.11.12 snmpInTotalReqVars 1.3.6.1.2.1.11.13 snmpInTotalSetVars 1.3.6.1.2.1.11.14 snmpInGetRequests 1.3.6.1.2.1.11.15 snmpInGetNexts 1.3.6.1.2.1.11.16 snmpInSetRequests 1.3.6.1.2.1.11.17 snmpInGetResponses 1.3.6.1.2.1.11.18 snmpInTraps 1.3.6.1.2.1.11.19 snmpOutTooBigs 1.3.6.1.2.1.11.20 snmpOutNoSuchNames 1.3.6.1.2.1.11.21 snmpOutBadValues 1.3.6.1.2.1.11.22 NOT USED 1.3.6.1.2.1.11.23 snmpOutGenErrs 1.3.6.1.2.1.11.24 snmpOutGetRequests 1.3.6.1.2.1.11.25 snmpOutGetNexts 1.3.6.1.2.1.11.26 snmpOutSetRequests 1.3.6.1.2.1.11.27 snmpOutGetResponses 1.3.6.1.2.1.11.28 snmpOutTraps 1.3.6.1.2.1.11.29 snmpEnableAuthenTraps 1.3.6.1.2.1.11.30
路由器和交换机:
通过SNMP监控
系统监控
重要指标: CPU 、内存 、IO Input/Output(网络、磁盘)
线程概念文章:
1、CPU
三个重要的概念:(单位:时间片)
- 上下文切换:CPU调度器实施的进程的切换过程,上下文切换 - 运行队列(负载):运行队列 - 使用率:确定服务类型:
- IO密集型 数据库
- CPU密集型 web mail 确定性能基准线:- 运行队列:1-3线程 1CPU 4核 负载不超过12
- CPU使用:65%-70% 用户态利用率
30-35% 内核态利用 0%-5% 空闲监控工具:top vmstat mpstat
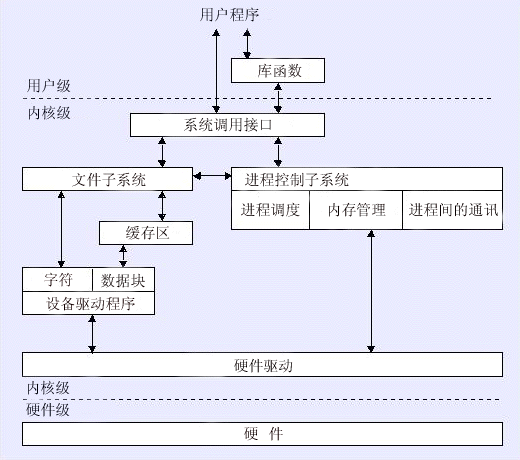
linux用户态和内核态
2、内存
单位: 页 4KB (读取按页为单位操作)
寻址、空间
监控工具:free、vmstat

根据available 查看可用内存
shared,进程间通信使用共享内存

si 数据从交换分区读取到内存的大小
so 数据从内存读取到交换分区的大小
3、硬盘
单位: 块
监控工具: df -h 、iotop (安装 yum install -y iotop)、iostat
IOPS IO's Per Second 每秒的IO请求次数
分类:顺序IO 、随机IO

4、网络
监控工具:iftop、Smokeping、Piwik
(国外访问站点的性能测试网址)
IBM nmon 二进制 性能测试用
应用监控
举例Nginx
依赖模块安装: yum install -y gcc glibc gcc-c++ pcre-devel openssl-devel wget
cd /usr/local/src
wget http://nginx.org/download/nginx-1.10.1.tar.gz
tar zxf nginx-1.10.1.tar.gz
备注: configure 是Shell脚本。执行它的作用:生成 Makefile文件
创建nginx用户 useradd -s /sbin/nologin -M nginx
编译安装
./configure --prefix=/usr/local/nginx-1.10.1 \--user=nginx --group=nginx \--with-http_ssl_module \--with-http_stub_status_module
make
make install
ln -s /usr/local/nginx-1.10.1/ /usr/local/nginx
查看80端口是否被暂用,启动nginx
/usr/local/nginx/sbin/nginx -c /usr/local/nginx/conf/nginx.conf
netstat -ntlp
启动状态监控
server { listen 9003; server_name 0.0.0.0; location /nginx_status { stub_status on; access_log off; allow 127.0.0.1; deny all; }} /usr/local/nginx/sbin/nginx -s reload